Dashboard & Monitoring
Real-time monitoring and analytics powered by Databricks SQL Warehouse.
Live Dashboard
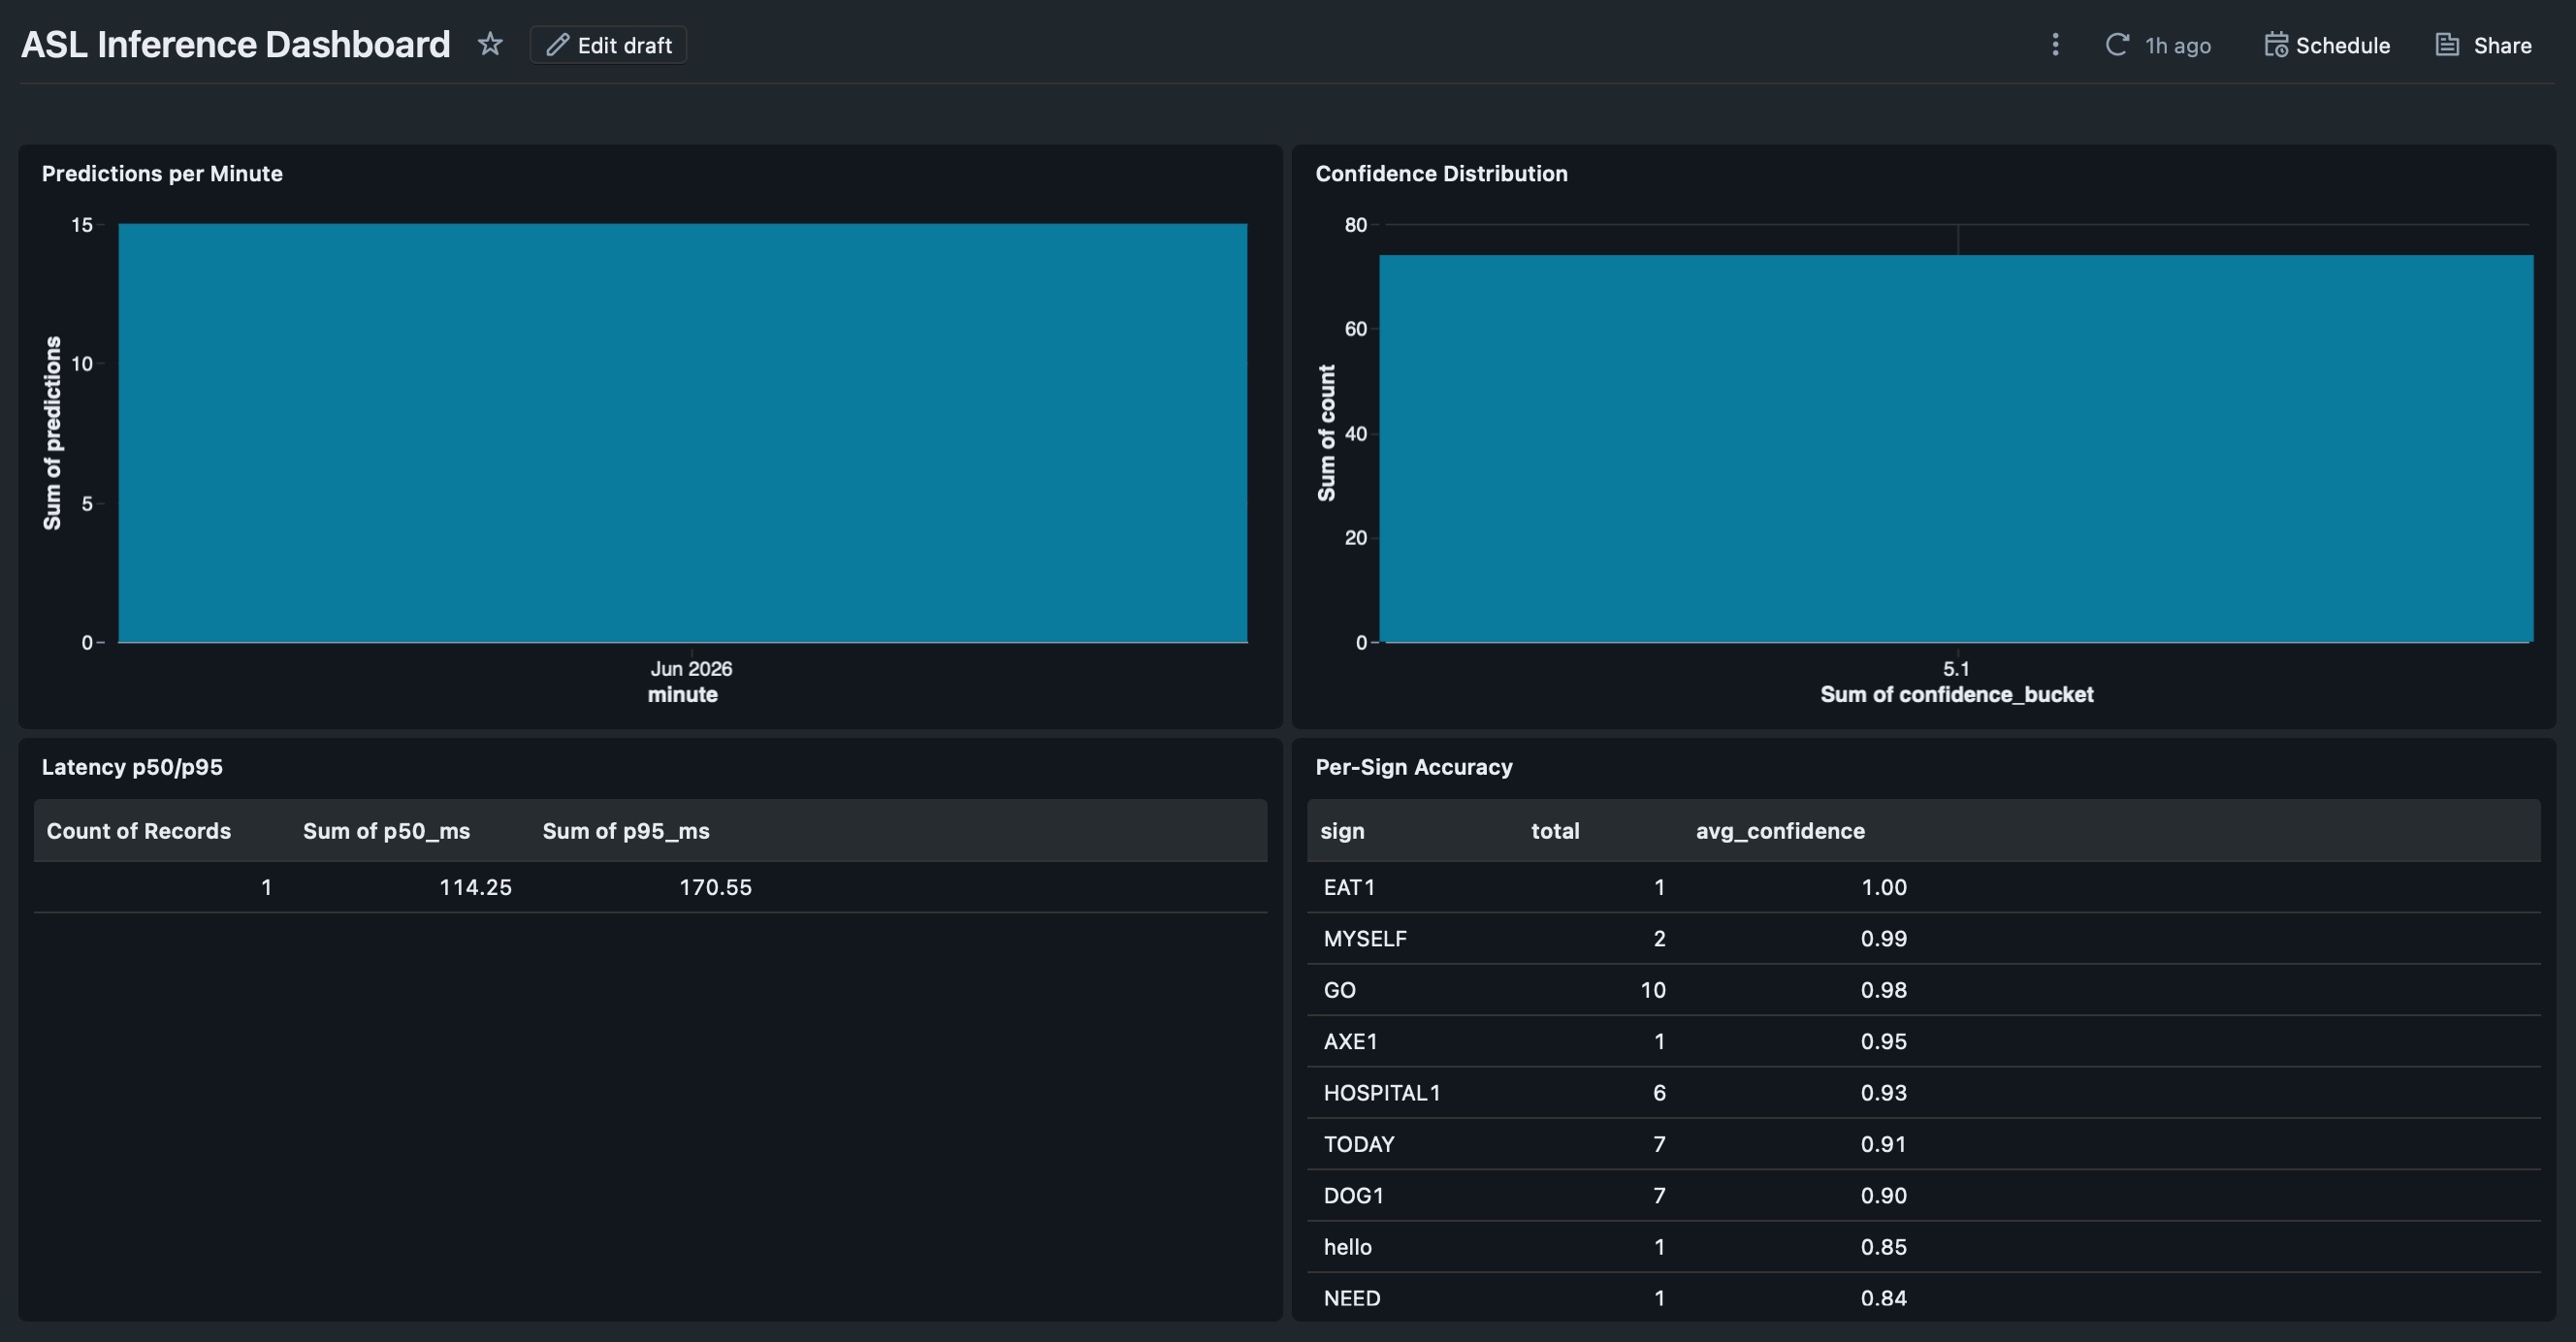
Platform: Databricks SQL Dashboard (hosted on Databricks Free Edition)
Data Source: asl.inferenceEvents Delta table (real-time stream from inferenceService)
Refresh Rate: Every 30 seconds
Visualizations: Area chart (predictions over time), bar chart (confidence distribution), table (latency percentiles), table (per-sign accuracy)
Headline Metrics
What We Monitor
- Predictions per hour — throughput; spikes signal active sessions, flatlines signal an outage
- Latency p50 / p95 per model — ST-GCN target p95 < 200 ms · RF target p95 < 60 ms
- Top signs + average confidence — surfaces which signs are tested most and which are hardest
- Low-confidence rate — percent of predictions under 0.40, the threshold the assembler drops at
- User feedback — thumbs up / down per sign from the UI
Key SQL Queries
1. Predictions Per Minute (live throughput)
SELECT
  DATE_TRUNC('minute', timestamp) AS minute,
  COUNT(*) AS predictions
FROM asl.inferenceEvents
WHERE timestamp >= NOW() - INTERVAL 1 HOUR
GROUP BY minute
ORDER BY minute;
What it measures: Real-time throughput. Alert threshold: If < 10 predictions in the last hour during demo time, service may be down.
2. Latency Percentiles (per model)
SELECT
  modelName,
  APPROX_PERCENTILE(latencyMs, 0.50) AS p50_ms,
  APPROX_PERCENTILE(latencyMs, 0.95) AS p95_ms,
  APPROX_PERCENTILE(latencyMs, 0.99) AS p99_ms
FROM asl.inferenceEvents
WHERE timestamp >= NOW() - INTERVAL 1 HOUR
GROUP BY modelName;
Expected p95: 180 ms (ST-GCN), 50 ms (Random Forest) Alert threshold: If p95 > 500 ms for > 5 minutes, investigate pod load or Databricks latency.
3. Per-Sign Accuracy Surface
SELECT
  sign,
  COUNT(*) AS total,
  AVG(confidence) AS avg_confidence
FROM asl.inferenceEvents
WHERE timestamp >= NOW() - INTERVAL 1 HOUR
GROUP BY sign
ORDER BY avg_confidence DESC;
What it shows: Which signs the model is most/least confident on. Low avg_confidence signs are candidates for retraining or vocab review.
4. Confidence Distribution
SELECT
  FLOOR(confidence * 10) AS confidence_bucket,
  COUNT(*) AS count
FROM asl.inferenceEvents
WHERE timestamp >= NOW() - INTERVAL 1 HOUR
GROUP BY confidence_bucket
ORDER BY confidence_bucket;
What it shows: Histogram of confidence scores. A long tail at low confidence indicates the assembler is dropping a lot of signs.
5. Low-Confidence Rate
SELECT
  modelName,
  COUNT(*) AS total,
  SUM(CASE WHEN confidence < 0.40 THEN 1 ELSE 0 END) AS low_conf,
  ROUND(100.0 * SUM(CASE WHEN confidence < 0.40 THEN 1 ELSE 0 END) / COUNT(*), 2) AS pct_low_conf
FROM asl.inferenceEvents
WHERE timestamp >= NOW() - INTERVAL 1 HOUR
GROUP BY modelName;
Alert threshold: If > 50% of predictions are low-confidence, suspect drift or out-of-vocab signing.
Alert Thresholds
| Alert | Condition | Action |
|---|---|---|
| Latency spike | p95 > 500 ms for ≥ 5 min | Check inferenceService pod logs, Databricks MLflow latency |
| High low-conf rate | > 50% predictions confidence < 0.40 | Drift detection — check user feedback for systematic errors |
| Service down | 0 predictions for > 10 min during demo window | Hit /health on each pod; check AKS pod status |
Custom Queries
Find Hard-to-Recognize Signs
SELECT
  sign,
  AVG(confidence) AS avg_conf,
  COUNT(*) AS times_tested
FROM asl.inferenceEvents
WHERE timestamp >= NOW() - INTERVAL 24 HOURS
GROUP BY sign
HAVING COUNT(*) >= 5
ORDER BY avg_conf ASC
LIMIT 10;
Model Drift Detection (day-over-day)
SELECT
  DATE(timestamp) AS date,
  modelName,
  AVG(confidence) AS avg_conf
FROM asl.inferenceEvents
GROUP BY DATE(timestamp), modelName
ORDER BY date DESC, modelName;
If avg_conf is dropping day-over-day, model may need retuning.
User Feedback Analysis
SELECT
  sign,
  SUM(CASE WHEN rating = 1 THEN 1 ELSE 0 END) AS thumbs_up,
  SUM(CASE WHEN rating = -1 THEN 1 ELSE 0 END) AS thumbs_down,
  COUNT(DISTINCT userId) AS unique_users
FROM asl.userFeedback
WHERE timestamp >= NOW() - INTERVAL 7 DAYS
GROUP BY sign
ORDER BY thumbs_down DESC;
High thumbs-down counts indicate which signs frustrate users most — feeds the next training cycle.
Integration with Evaluation
The asl.inferenceEvents table also feeds the pipeline evaluation:
-- Ablation: did the pipeline improve?
SELECT
  variant,
  AVG(bleu) AS mean_bleu,
  AVG(chrF) AS mean_chrf
FROM asl.evaluationResults
GROUP BY variant;
This confirms the corrective stages (Assembler + Translator) are delivering value — see Correction Pipeline for the current ablation numbers.